Profiling Compound Effects on Cell Health in a Time Course Using a Multiplexed Same-Well Assay
Brad Hook and Trista Schagat, Promega Corporation
Publication Date: 2012
Abstract
Cell health assays are essential for evaluating compound effects on cells. Traditionally these assays are performed at a specified endpoint after the chosen exposure time. In this study, we monitored compound effects on cell health at various time points during exposure and report how certain activity-based cell health biomarkers changed, thus affecting the apparent potency of cytotoxic agents. We highlight the dynamic nature of activity-based cytotoxicity biomarkers and the need for multi-parameter analysis to avoid misinterpreting a compound’s biological impact, which can happen when performing a single-time-point evaluation. Cells were treated with serial dilutions of seven compounds over a time course, from 3 hours to 72 hours. Using the ApoTox-Glo™ Triplex Assay to measure cell health (viability, cytotoxicity and apoptosis), we identified important factors involved in studying compound effects on cell biology.
Introduction
Profiling the effects of a compound or treatment on cells involves some measure of the impact on cell health. The drug discovery process requires the use of diverse assays to assess the various effects of compounds (1). Target-specific assays, as well as those that assess off-target effects and cytotoxicity, are all helpful in generating a broad profile of compound reactivity. Many times, results from diverse assays can drive lead selection and optimization for preclinical testing. Whether directly studying apoptotic inducers or simply wanting to understand the effects of a treatment on cell health, scientists need to consider several key factors for good experimental design: compound dose, exposure period and the selection of relevant biological markers.
Single-point assays are not always sufficient to assess cell health or the mechanisms of toxicity. Multiplexing assays to gather more than one set of data from a sample well can have many advantages: more data per sample well, which provide additional information about cellular response and mode of cell death, and improved consistency compared to assays that use parallel samples (2). Planning these multi-parameter assay experiments can be difficult and requires proper consideration to ensure the most valuable outcome. Improper experimental design can lead to data misinterpretation, low signals and inconsistent results. When testing the effects of a compound on cell health, the kinetics of cytotoxicity often differ, depending on a wide variety of factors, such as cell line, compound type, compound concentration or stimulus intensity, and exposure time. Therefore, it is critical to choose the proper assays to demonstrate changes in cell health in conjunction with the appropriate assay controls.
We chose the ApoTox-Glo™ Triplex Assay to monitor the health of cells exposed to compounds over a time course. This assay combines three Promega assay chemistries to assess viability, cytotoxicity and caspase-3/7 activation events within a single assay well (3) and is useful for determining the mechanism of cell death (Figure 1). The first part of the assay simultaneously measures two protease activities whose detection depends on membrane permeability changes during cell death (4): One protease is a marker of cell viability (the live-cell protease within intact cells is detected with a cell-permeant fluorescent substrate), and the other is a marker of cytotoxicity (the dead-cell protease is released into the medium and detected with a cell-impermeant substrate) (Figure 2). The live- and dead-cell proteases produce different fluorescent products that have different excitation and emission spectra, allowing them to be detected simultaneously. The second part of the assay uses the bioluminescent Caspase-Glo® Assay technology, which provides a luminogenic caspase-3/7 substrate with the tetrapeptide sequence DEVD in a reagent optimized for caspase activity, luciferase activity and cell lysis. Adding the Caspase-Glo® 3/7 Reagent directly to the same sample wells in an “add-mix-measure” format results in cell lysis, followed by caspase cleavage of the substrate and generation of a “glow-type” luminescent signal produced by luciferase (Figure 3). Luminescence is proportional to the level of caspase-3/7 activity.
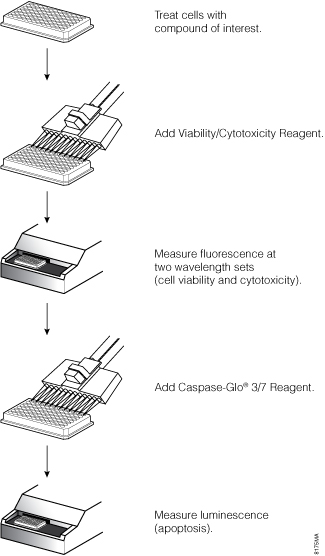
Figure 1. Schematic diagram of the ApoTox-Glo™ Triplex Assay. Cell viability fluorescence is measured at 400nmEx/505nmEm, cytotoxicity fluorescence is measured at 485nmEx/520nmEm and apoptosis is determined by luminescence measurement.
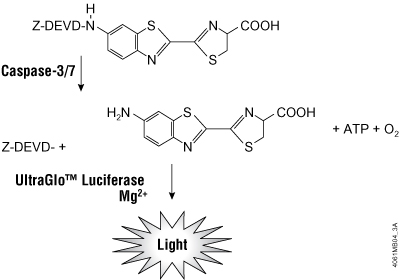
Figure 2. ApoTox-Glo™ Triplex Assay chemistries. Caspase-3/7 cleavage of the luminogenic substrate containing the DEVD sequence. Following caspase cleavage, a substrate for luciferase (aminoluciferin) is released, resulting in the luciferase reaction and the production of light.
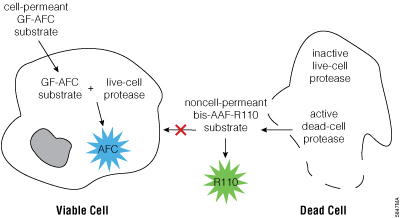
Figure 3. ApoTox-Glo™ Triplex Assay chemistries. The GF-AFC Substrate can enter live cells, where it is cleaved by the live-cell protease to release AFC. The bis-AAF-R110 Substrate cannot enter live cells but, upon the membrane becoming compromised, can be cleaved by the dead-cell protease to release R110.
In this article, we examined the effects of compounds on cell health over time, tracked how various biomarker activities change and demonstrated the impact that compound dose has on assay measures. Cell health assays are typically employed in single endpoint formats, but here we highlight the dynamic nature of activity measurements and the need for time-course monitoring of cytotoxicity. Cells were treated with seven compounds at various dosages for 3 hours to 72 hours. Using the ApoTox-Glo™ Triplex Assay to measure cell health (viability, cytotoxicity and apoptosis), we identified important factors involved in studying compound effects on cells.
Results and Discussion
In experiments to study the effects of a compound on a cell, determining when to measure changes in cell health is critical. Compounds affect cell biology through many different pathways and at different rates that depend on exposure dosage; therefore, there is no single time that will work for all compounds. The ideal time to assay cell health has to be empirically determined. To demonstrate this, we examined the effect of several common compounds on cell health over time:
- Staurosporine: a broad-spectrum kinase inhibitor that causes cell death through apoptosis
- Colchicine: a microtubule assembly poison and cell-cycle-arrest agent
- Bortezomib: a proteasome inhibitor
- Aflatoxin: a xenobiotic pro-toxin
- Terfenadine: a xenobiotic toxin
- Camptothecin: a topoisomerase inhibitor
- Ionomycin: a calcium ionophore that causes primary necrosis
We titrated these compounds to examine the effect of dosage over time. All compounds were serially diluted tenfold from 100µM to 0.01µM except for staurosporine, which was serially diluted tenfold from 10µM to 0.001µM. We monitored cell viability, cytotoxicity and apoptosis using the ApoTox-Glo™ Triplex Assay after 3, 6, 23, 31, 47, 55 and 72 hours of exposure (Figures 4–10).
Staurosporine, known to cause cell death through the apoptotic pathway, is a good example of how proper timing is important when assaying cell health. When cells were assayed at 6 hours of 10µM staurosporine treatment, a large decrease in cell viability and a large increase in cytotoxicity was observed (Figure 4, Panels A and B). During this same time period, the caspase-3/7 induction signal also was very prominent, indicating that staurosporine was activating the apoptotic pathway (Figure 4, Panel C). When cells were assayed at 23 hours, viability was low and cytotoxicity was high, but the apoptotic signal (caspase-3/7 induction) was now much lower than that at 6 hours (Figure 4, Panels A, B and C). This decrease in apoptosis-related signal can be explained by caspase biomarker decay due to progression to secondary necrosis. When measured at even later time points of exposure, caspase and viability values were near background, and the cytotoxicity value was reduced, too, because the cells had died and the released protease activity had decayed. For staurosporine at 10µM, a common compound test concentration, timing of cell health assays was critical in understanding the mechanism of cell death. If cells were assayed after 23 hours of staurosporine exposure, one might conclude that this compound is toxic to cells and results in primary necrosis, because the apoptosis signal is near background; however, at 6 hours one can clearly see that staurosporine caused cell death by inducing apoptosis, as determined by the caspase-3/7 activity assay.
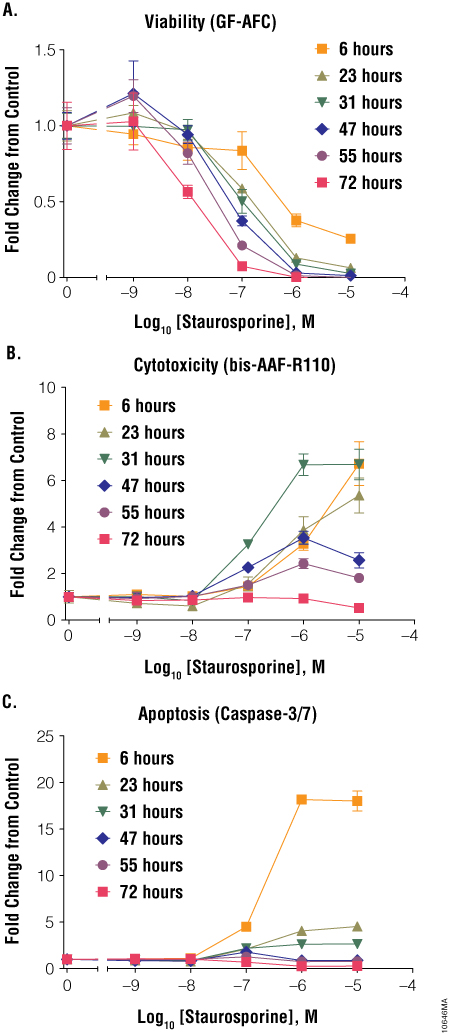
Figure 4. Treatment of cells with staurosporine. Jurkat cells (10,000 cells/well) were treated with serially diluted staurosporine, and cell viability (Panel A), cytotoxicity (Panel B) and apoptosis (Panel C) were assayed after 6, 23, 31, 47, 55 and 72 hours using the ApoTox-Glo™ Triplex Assay. Fold change from the untreated cells control (concentration = 0M) was calculated for all data points.
Colchicine induced apoptosis but at a time point much later than staurosporine (Figure 5, Panel C). At 6 hours, the apoptosis signal was near background; however, at 23 and 31 hours, the caspase-3/7 signal was elevated relative to untreated cells. At even later times, such as 47, 55 and 72 hours, the apoptotic signal was again reduced, because most cells had progressed to secondary necrosis. The cell viability and cytotoxicity data mirrored the apoptosis data, because there were few dead cells at 6 hours but a significant increase at 23 and 31 hours (Figure 5, Panels A and B). Therefore, the ideal time to assay cell health for colchicine (with this cell line) was ~24 hours; assaying cells too early or too late would result in missing the peak apoptotic signal.
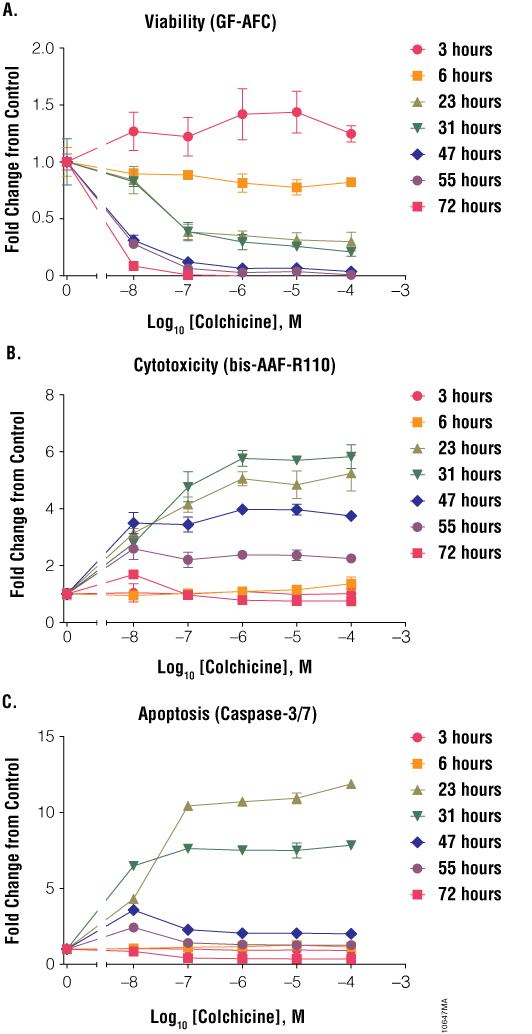
Figure 5. Treatment of cells with colchicine. Jurkat cells (10,000 cells/well) were treated with serially diluted colchicine, and cell viability (Panel A), cytotoxicity (Panel B) and apoptosis (Panel C) were assayed after 3, 6, 23, 31, 47, 55 and 72 hours using the ApoTox-Glo™ Triplex Assay. Fold change from the untreated cells control (concentration = 0M) was calculated for all data points.
Bortezomib resulted in low apoptotic and cytotoxicity signals at 3 and 6 hours (Figure 6, Panels B and C); however, at 23 hours there was a large spike in caspase-3/7 activation. This spike in caspase-dependent apoptosis led to a large increase in cytotoxicity at 31 hours and a large decrease in cell viability (Figure 6, Panel A). If cells were assayed at a later time, one might underestimate or fail to identify apoptosis as the mechanism of cell death and obtain low cytotoxicity results. These results with staurosporine, colchicine and bortezomib show that timing of cell health assays is critical for proper data interpretation.
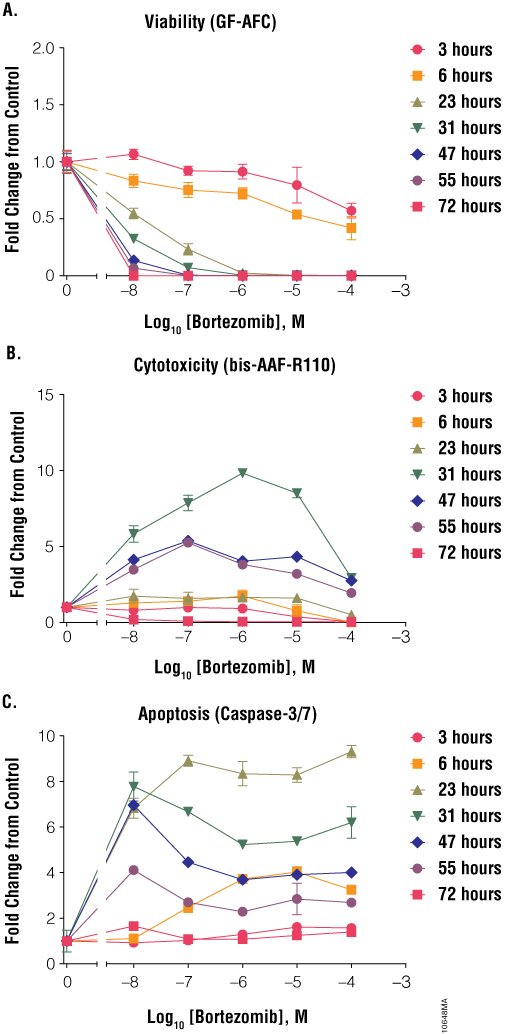
Figure 6. Treatment of cells with bortezomib. Jurkat cells (10,000 cells/well) were treated with serially diluted bortezomib, and cell viability (Panel A), cytotoxicity (Panel B) and apoptosis (Panel C) were assayed after 3, 6, 23, 31, 47, 55 and 72 hours using the ApoTox-Glo™ Triplex Assay. Fold change from the untreated cells control (concentration = 0M) was calculated for all data points.
Dose also is critical when performing cell health assays because compounds affect cells in different ways at different concentrations. Subtoxic compound concentrations may not reveal cytotoxic liability observed at potentially relevant concentrations. Conversely, even relatively inert compounds may produce cytotoxic effects when used at excess concentrations that are irrelevant to biological systems. Therefore, it is necessary to establish a range of concentrations relevant to the biological system to properly estimate cytotoxic potential. Some compounds have a small range of concentrations that will result in maximal cell health assay results, whereas other compounds can be added at a large range of concentrations. Staurosporine at 0.001, 0.01 and 0.1µM resulted in low cytotoxicity and apoptosis but at 1 and 10µM yielded large responses (Figure 4). Colchicine had observable effects on cells at a large concentration range (0.1–100µM, Figure 5). Aflatoxin affected cells only at a high concentration (100µM, Figure 7), presumably because the pro-toxin was not efficiently metabolized into the toxic form by Jurkat cells. These effects were seen only after 47 hours of exposure to the compound. Terfenadine had a very narrow dosage window (Figure 8). Below 1µM, there were no effects on cell health. At 10µM terfenadine, there was a large decrease in cell viability, a large increase in apoptosis and a large increase in cytotoxicity. At 100µM, most cells were dead; therefore, viability was low, apoptosis was low and cytotoxicity was high (at early time points). If cells were assayed at only 100µM, one might conclude that terfenadine does not induce apoptosis but primary necrosis; however, if cells were assayed at 10µM, one might conclude that terfenadine stimulated the apoptotic pathway. Without testing a range of concentrations and time points, the impact of a compound on cell health could be misinterpreted.
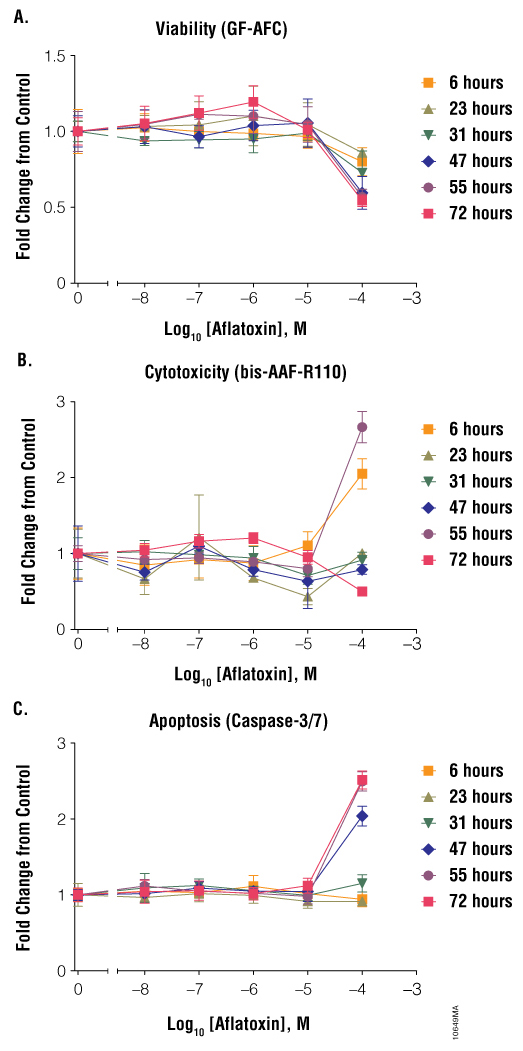
Figure 7. Treatment of cells with aflatoxin. Jurkat cells (10,000 cells/well) were treated with serially diluted aflatoxin, and cell viability (Panel A), cytotoxicity (Panel B) and apoptosis (Panel C) were assayed after 6, 23, 31, 47, 55 and 72 hours using the ApoTox-Glo™ Triplex Assay. Fold change from the untreated cells control (concentration = 0M) was calculated for all data points.
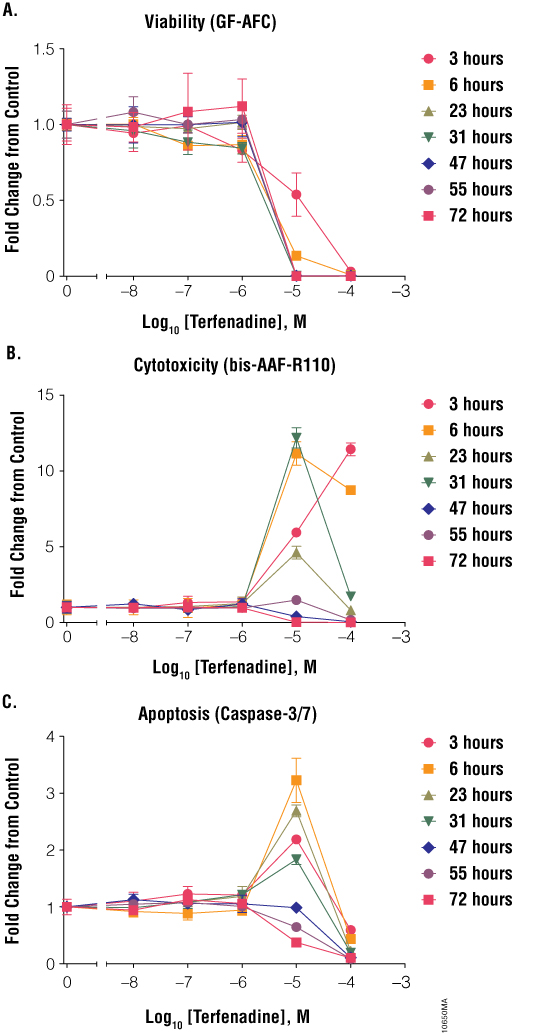
Figure 8. Treatment of cells with terfenadine. Jurkat cells (10,000 cells/well) were treated with serially diluted terfenadine, and cell viability (Panel A), cytotoxicity (Panel B) and apoptosis (Panel C) were assayed after 6, 23, 31, 47, 55 and 72 hours using the ApoTox-Glo™ Triplex Assay. Fold change from the untreated cells control (concentration = 0M) was calculated for all data points.
Timing and dosage are important parameters to consider when assigning a mechanism of action to a cytotoxic response. When used appropriately, the ApoTox-Glo™ Triplex Assay can produce biomarker profiles that can define a primary necrotic or apoptotic event. Staurosporine induced apoptosis at 6 hours and resulted in a loss in cell viability and an increase in cytotoxicity (Figure 9, Panel A). Staurosporine is a known activator of the caspase cascade pathway. Ionomycin did not induce apoptosis but still resulted in an increase in cytotoxicity, indicating primary necrosis (Figure 9, Panel B). Although the compounds initiated different cell death mechanisms, both ultimately led to loss of membrane integrity. As discussed earlier, timing was also important for proper interpretation of the cell death mechanism, because assaying cells too early or too late might result in missing a potential apoptotic signal.
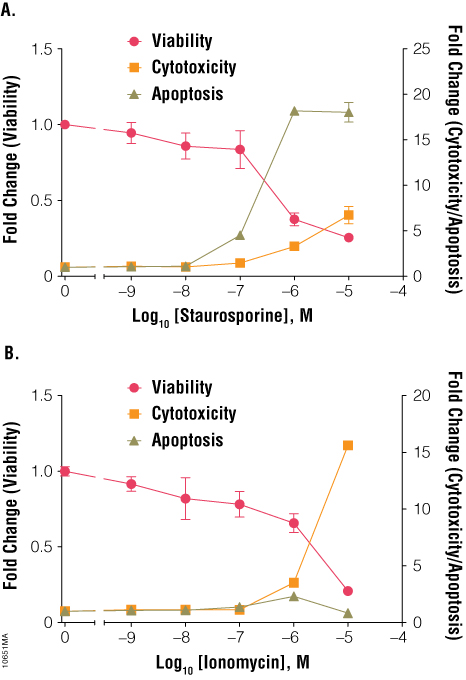
Figure 9. Treatment of cells with staurosporine and ionomycin for 6 hours. Jurkat cells (10,000 cells/well) were treated with serially diluted staurosporine (Panel A) or ionomycin (Panel B), and cell viability, cytotoxicity and apoptosis were assayed after 6 hours using the ApoTox-Glo™ Triplex Assay. Fold change from the untreated cells control (concentration = 0M) was calculated for all data points.
Another consideration when performing cell health assays is compound interference. Common mechanisms of compound interference are enzymatic inhibition, light or fluorescence quenching, and autofluorescence. For the ApoTox-Glo™ Triplex Assay, enzymatic inhibition of luciferase, a component of the Caspase-Glo® 3/7 Reagent, is statistically rare because this assay uses an evolved luciferase (Ultra-Glo™ Luciferase) that is more resistant to luciferase inhibitors than native luciferase (5). A more common problem is compound autofluorescence and fluorescence quenching. The ApoTox-Glo™ Triplex Assay uses two spectrally distinct fluorophores for viability and cytotoxicity measures, helping to mitigate the chances that autofluorescence will occur in both channels. This built-in redundancy, known as “flagging”, helps when results are not as expected (e.g., one signal is up and one is down). Users can examine the data to determine if this “flag” is due to interference. If only one measurement was used, one would never know if an interference existed. One example of this type of “flagging” was found when using camptothecin. Camptothecin induced apoptosis and resulted in cytotoxicity between 3 and 31 hours (Figure 10, Panels B and C). Viability appeared to increase dramatically at higher concentrations (Figure 10, Panel A). When the compound was tested alone (no cells) at 3 hours, there was no change in cytotoxicity and apoptotic signals; however, viability increased eightfold (Figure 10, Panel D). The emission maximum of camptothecin is ~450nm, similar to the wavelength at which the viability biomarker was measured: 495–505nm (6). Being aware of compound interference and performing compound-only controls can reduce potential misinterpretation of data.
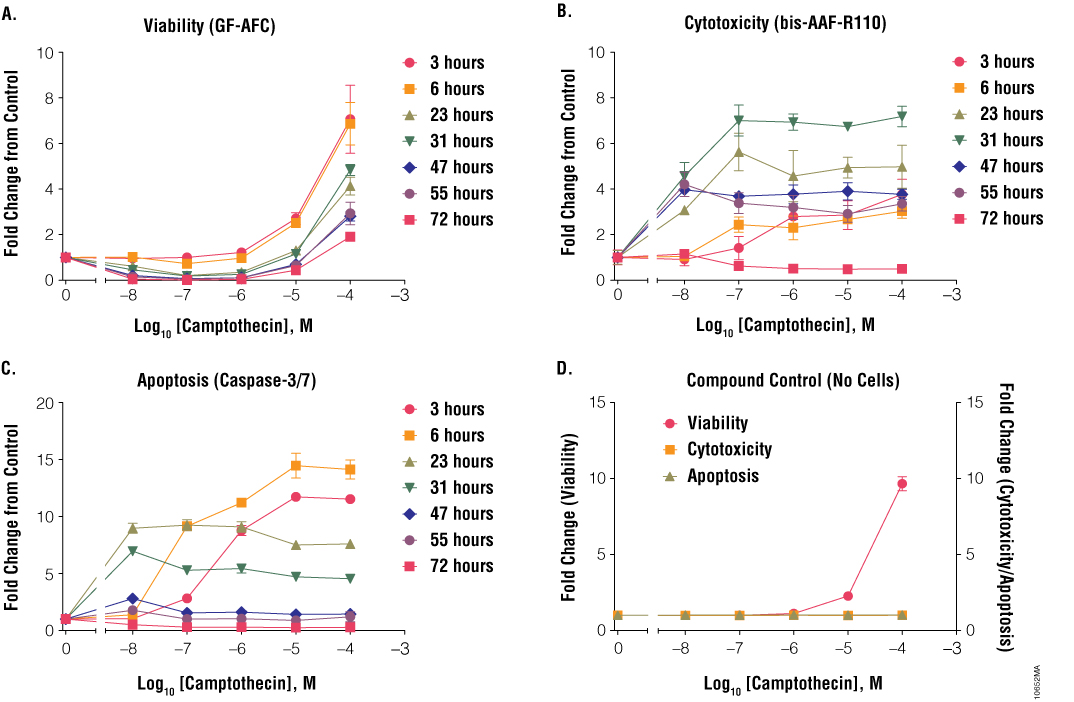
Figure 10. Treatment of cells with camptothecin. Jurkat cells (10,000 cells/well) were treated with serially diluted camptothecin, and cell viability (Panel A), cytotoxicity (Panel B) and apoptosis (Panel C) were assayed after 6, 23, 31, 47, 55 and 72 hours using the ApoTox-Glo™ Triplex Assay. Fold change from the untreated cells control (concentration = 0M) was calculated for all data points.
Different cell types may respond differently to identical treatment regimens. Some cells may be more resistant to a compound than others. The same agent may induce apoptosis in one cell type but not in other cells. For example, treating HL60 and K562 cells with similar concentrations of doxorubicin produced an apoptotic morphology and DNA laddering in HL60 cells but a necrotic morphology and no DNA fragmentation in K562 cells (7). The time required for a compound to induce a response also may change with different cell types.
Methods
Dilution of compounds: All compounds were initially resuspended and diluted in DMSO. We diluted compounds in medium and added them to cells, with a final DMSO concentration of 1% in each well. We serially diluted staurosporine tenfold from 10µM to 0.001µM, and ionomycin, aflatoxin, camptothecin, colchicine and bortezomib tenfold from 100µM to 0.01µM.
Dilution of cells: We collected, counted and diluted Jurkat cells to 2 × 10⁵ cells/ml in RPMI medium with 10% fetal bovine serum and added 50µl of diluted cells to 96-well white Costar® tissue culture-treated plates (see Figure 11) at a final concentration of 10,000 cells/well. We added 50µl of medium to wells in column 11, rows B–G, as reagent background controls. We added 300µl of RPMI medium to all outer wells of the plates. We set up seven plates for each compound (one for each time point), with each plate containing three test compounds. Each concentration was tested in triplicate.
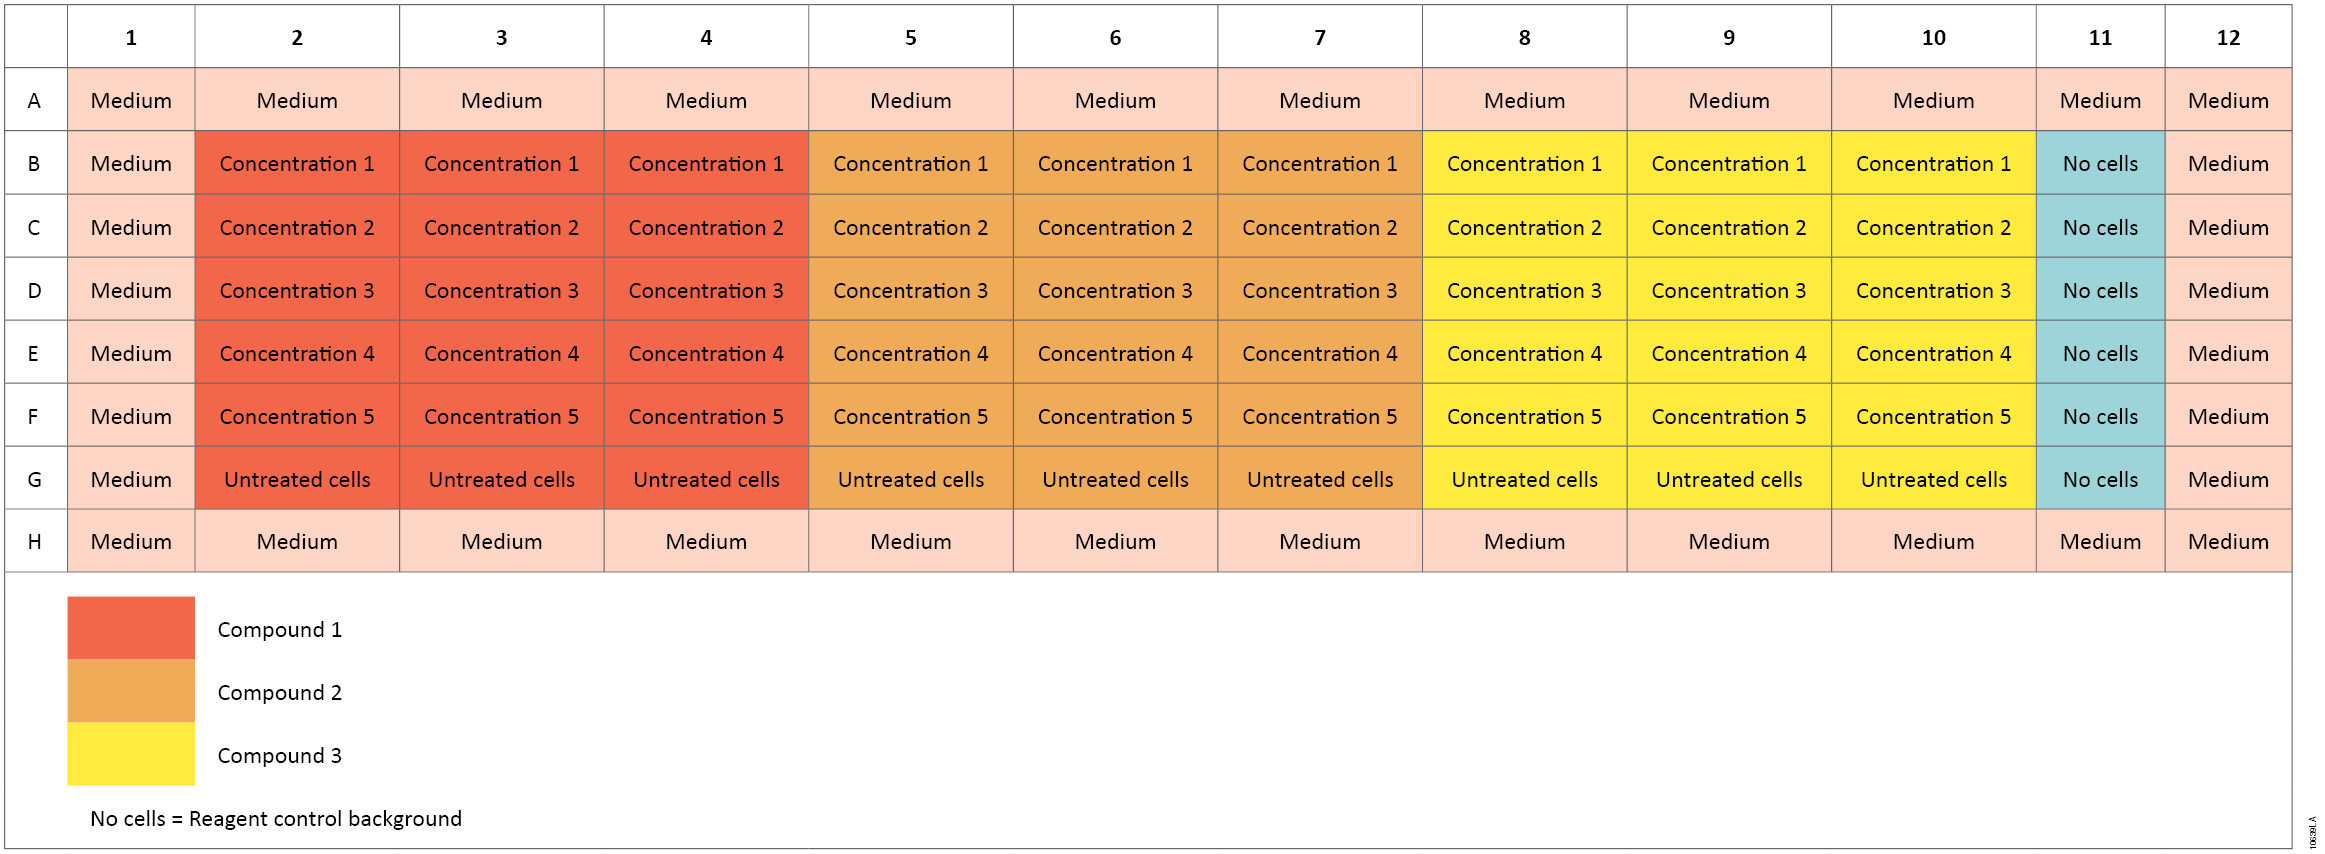
Figure 11. Plate setup for the ApoTox-Glo™ Assay.
Addition of compound: We added 50µl of diluted compound to the appropriate wells of cells for a final volume of 100µl/well. We then mixed the plates briefly and incubated them at 37°C with 5% CO2 for the appropriate time.
Time Course: We assayed plates after 3 hours, 6 hours, 23 hours, 31 hours, 47 hours, 55 hours and 72 hours of exposure to the compounds.
Assay: We assayed cell viability, cytotoxicity and caspase-3/7 activity using the ApoTox-Glo™ Triplex Assay as described in the ApoTox-Glo™ Triplex Assay Technical Manual TM322 for each plate (columns 2–11, rows B–G). We measured fluorescence (cell viability fluorescence at 400nmex/505nmem and cytotoxicity fluorescence at 485nmEx/520nmEm) and luminescence using a GloMax® Multi+ Detection System.
Data processing: We calculated background signal by averaging the no-cell wells (medium plus reagents). After subtracting background, we calculated averages and standard deviations, then fold change compared to the untreated cells control (UTC) for each compound concentration. A worksheet is provided to help process the data and create graphs at: www.promega.com/resources/tools/apotoxglo-triplex-assay-worksheet/
References
- Riss, T., Moravec, R. and Niles, A. (2005) Selecting cell-based assay for drug discovery screening. Cell Notes 13, 16–21.
- Hooper, K. (2011) Multiplexing cell-based assays: Get more biologically relevant data. Promega PubHub.
- Shultz, S. (2009) Determining the predictive mechanism of toxicity using a single-well multiplexed assay. Promega PubHub.
- Niles, A.L. et al. (2007) A homogeneous assay to measure live and dead cells in the same sample by detecting different protease markers. Anal. Biochem. 366, 197–206.
- Auld, D.S. et al. (2009) A basis for reduced chemical library inhibition of firefly luciferase obtained from directed evolution. J. Med. Chem. 52, 1450–8.
- Ziomkowska, B. et al. (2006) Deactivation rate of camptothecin determined by factor analysis of steady-state fluorescence and absorption spectra. Optica Applicata 36, 137–46.
- Jessel, R. et al. (2002) Kinetics of apoptotic markers in exogeneously induced apoptosis of EL4 cells. J. Cell Mol. Med. 6, 82–92.
Learn more about the ApoTox-Glo™ Triplex Assay